RegioData
Where is your regional sales potential? RegioData answers this question for over 85 product categories in the building materials industry — at postal code level, across all of Europe and North America. You receive the data in two formats: as an Excel dataset (RegioData Set) for independent processing in your own systems, or as a fully configured web application (RegioData PotenzialApp) that your team can use directly in the browser without GIS expertise.
RegioData Set
The RegioData Set is a structured dataset that quantifies regional sales potential for building and renovation products at postal code and district level (NUTS 3) — across 20+ European countries as well as the USA and Canada. You receive the data as an Excel file and process it independently in your CRM, sales planning, or GIS system.
Typical use: You load the file into your system, link the potential values with your sales data per postal code area, and immediately see where your market penetration is high or low. The data forms the basis for territory planning, target agreements, and location assessments.
Available in 20+ Countries
RegioData covers all of Europe — from Portugal to Poland, from Norway to Turkey — as well as the USA and Canada. The same proven methodology is applied to each country, adapted to local data landscapes and distribution structures.
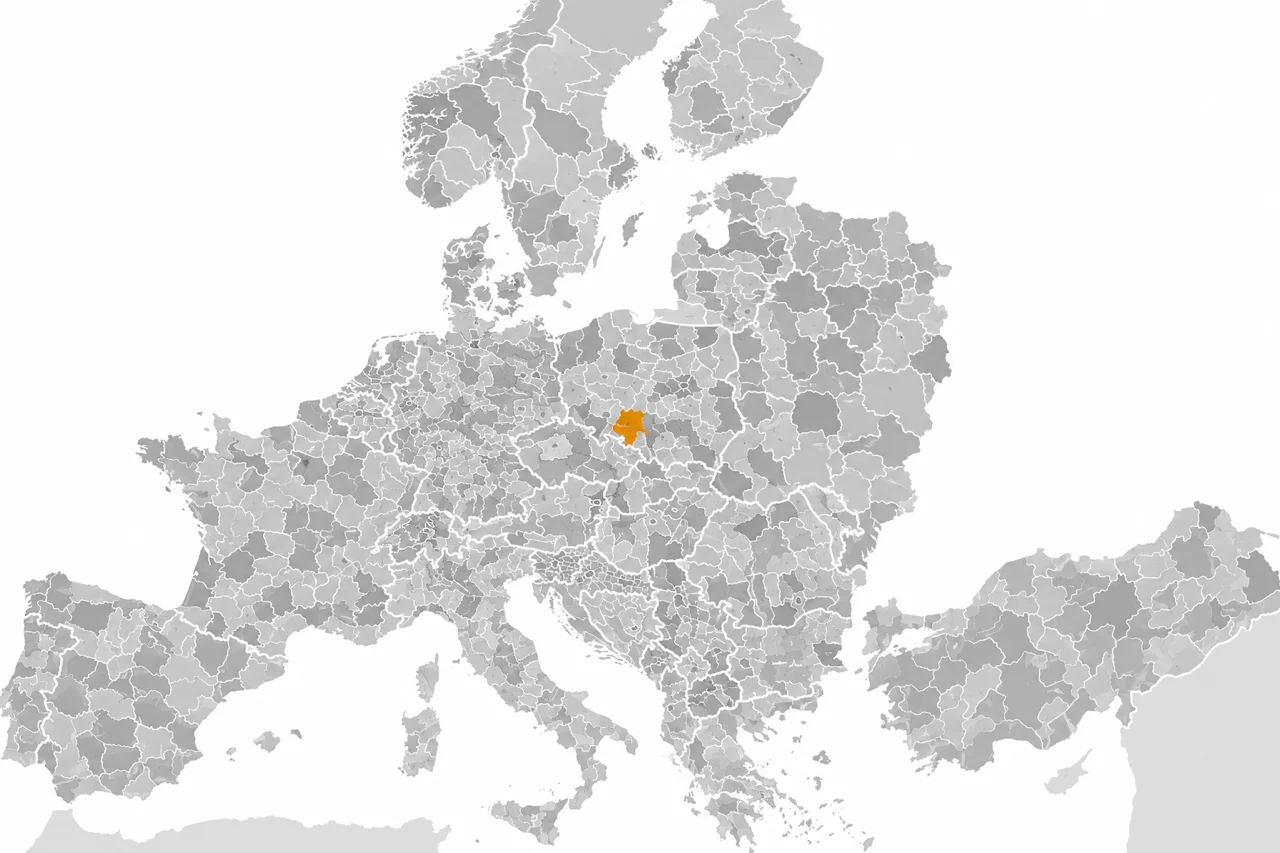
Full coverage from Portugal to Poland and from Norway to Turkey. All major European building materials markets at postal code level.
USA and Canada — at ZIP code and postal code level. The same methodology, adapted to North American market structures.
Typical applications of the RegioData Set
Pinpoint the postal code areas with the highest demand potential for your specific product categories. Focus your sales force where the market is.
Compare your actual sales against the calculated market potential for every region, territory, and point of sale. See exactly where you are over- or under-performing.
Redesign sales territories based on actual market potential rather than historical boundaries. Balance workload and opportunity across your field organization.
Assess the potential of existing and planned warehouse, showroom, or branch locations against the surrounding market demand.
Optimize delivery routes and warehouse locations based on where demand is concentrated. Reduce costs while improving service levels.
Base your annual sales targets on actual market potential rather than last year's numbers plus a percentage. Give your sales team targets they can believe in.
Three data levels
RegioData is available at three distribution levels, allowing manufacturers and wholesalers to analyze the market from their specific perspective.
All potentials at manufacturer prices, independent of distribution channel. The complete market view for strategic planning.
Only potentials distributed via wholesale, including trade margins. Shows the real opportunity for wholesale organizations.
Potentials distributed via specialist retail and DIY stores, including trade margins. The retail perspective on regional demand.
The WBR Index
At the heart of RegioData is the WBR Index (Wohnen, Bauen, Renovieren) — a proprietary statistical model developed by B+L over 25 years ago. The WBR Index measures the relative market potential for construction and renovation products at postal code level.
The model uses a non-linear multiple regression approach that considers construction activity, renovation rates, income levels, craftsman density, population density, single-family home share, and other category-specific factors. Through decades of industry use and continuous calibration, the WBR Index has become the standard reference for regional market assessment in the building materials industry.
RegioData PotenzialApp
The RegioData PotenzialApp is a web application based on RegioData market potentials, individually configured for each client. Unlike the RegioData Set, which you process yourself, the PotenzialApp provides a ready-made analysis interface in your browser — tailored to your product categories, sales territories, and locations.
B+L sets up the application separately for each client: We configure exactly the product groups, distribution levels, and competitor locations relevant to your business. Your employees or member companies can then independently perform territory analyses without GIS expertise.
Trade associations and purchasing cooperatives offer the PotenzialApp as a service for their member companies. Each location sees its individual market potential, can define catchment areas, and assess its own market penetration against the regional potential.
Manufacturers use the PotenzialApp to identify market potentials at customer locations, evaluate territory overlaps between trade partners, and assess the potential of individual distribution partners on a data-driven basis — without having to operate their own GIS infrastructure.
PotenzialApp features
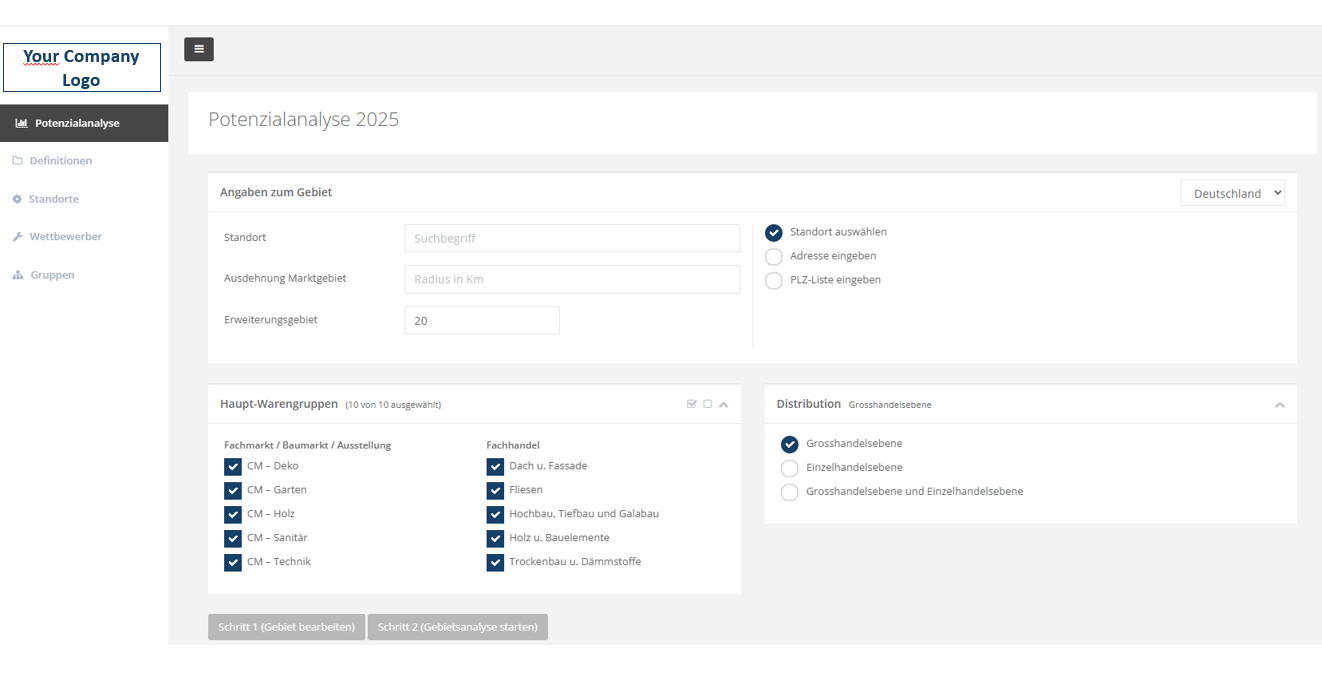
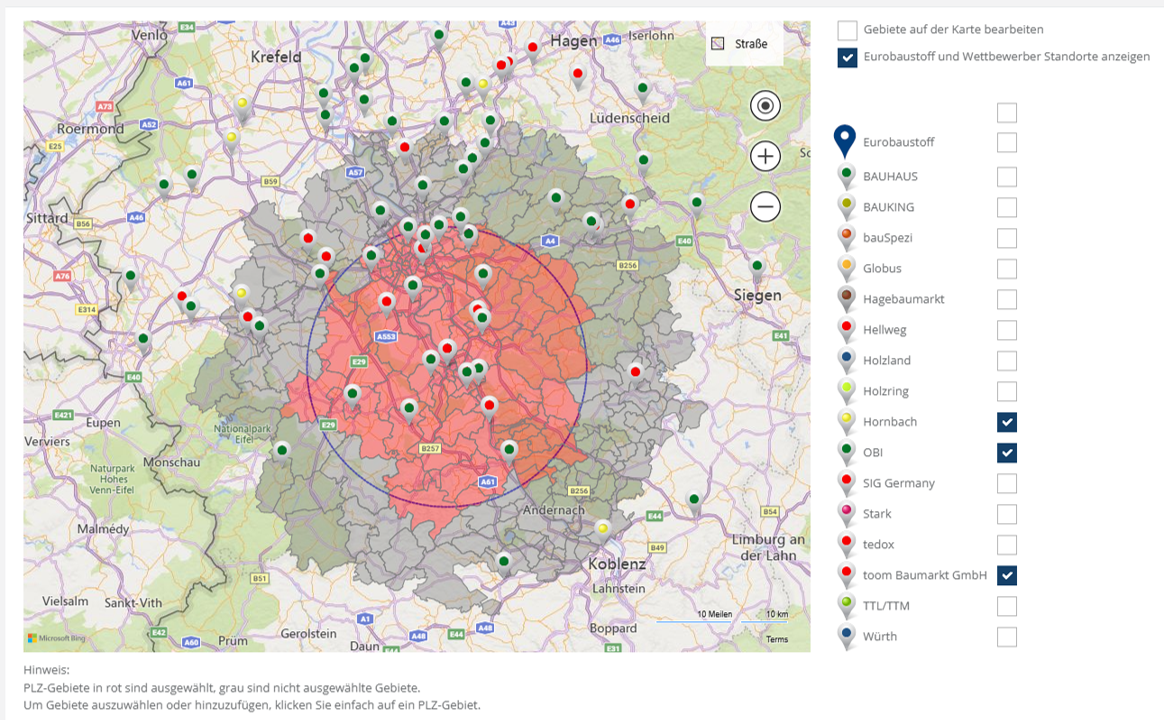
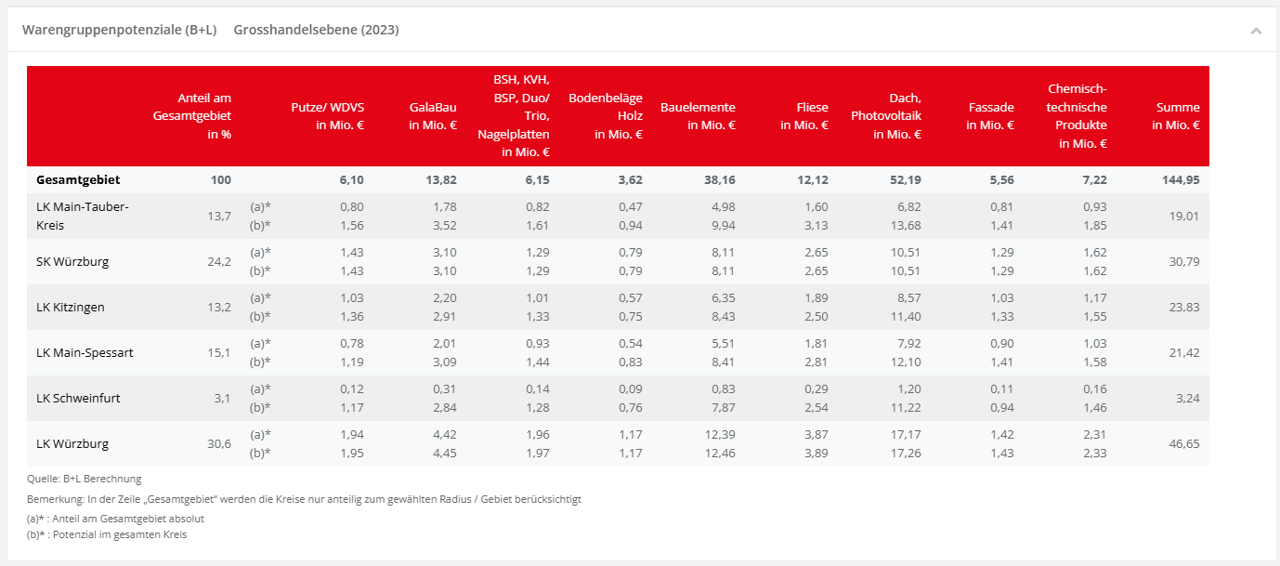
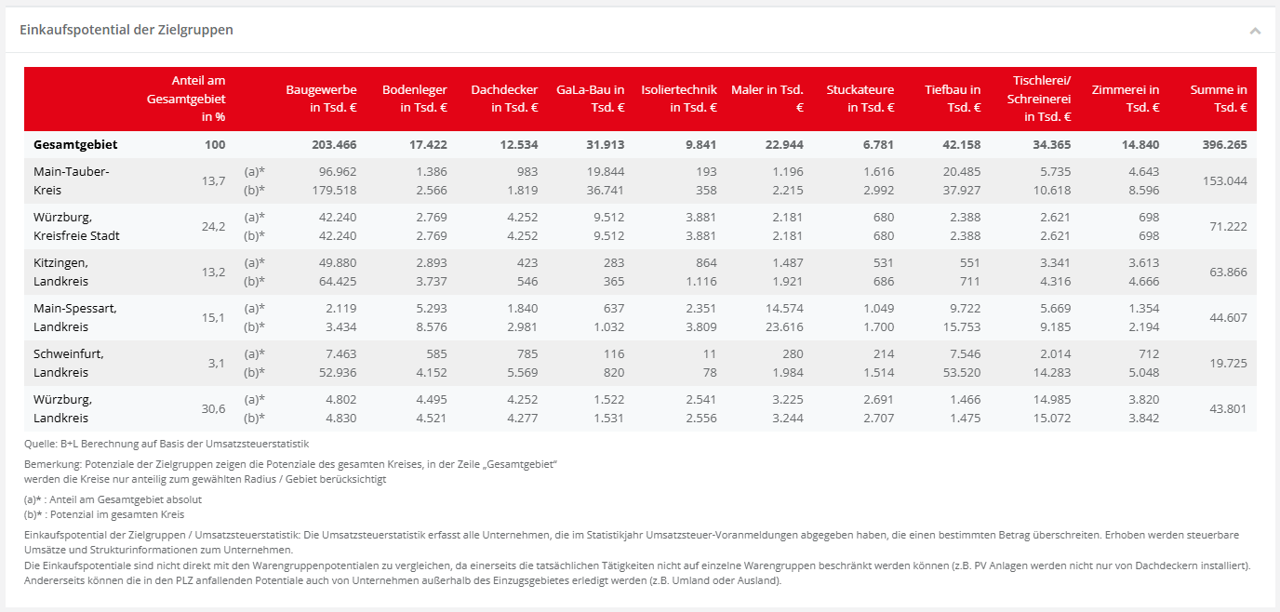
Identify and evaluate overlaps between catchment areas of different locations. Basis for territory optimization and fair target agreements.
Results are calculated in real time and displayed as a territory report — no waiting, no manual data preparation.